Key Take Aways About Cryptocurrency Trading
- Cryptocurrency charts visualize price movements over time to aid trading decisions.
- Key chart types: Line (basic view), Bar (detailed prices), Candlestick (popular for insights).
- Technical analysis uses past data to forecast trends; includes support/resistance and moving averages (SMA, EMA).
- Relative Strength Index (RSI) measures price momentum; crucial for spotting overbought/oversold conditions.
- Trading strategies: Day trading (quick), Scalping (small profits), Swing trading (market waves).
- Emotional control is critical; discipline overcomes fear and greed.
- Regular practice and chart study improve market navigation.
Understanding Cryptocurrency Trading Charts
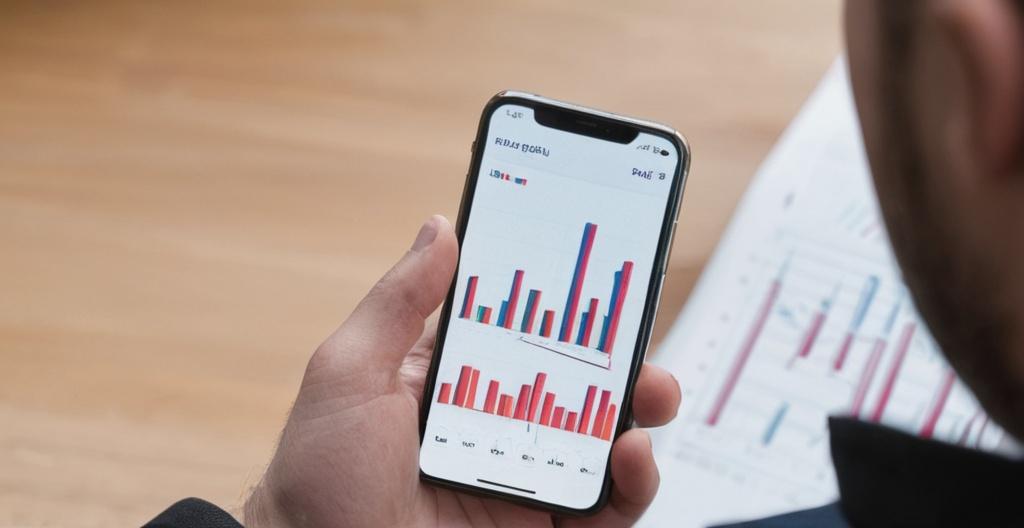
Cryptocurrency trading charts are a bit like the weather forecast, they don’t predict the future, but they can give you an idea of what’s coming. A chart is a graphical representation of price movements over time. Traders use these charts to spot patterns and make decisions about when to buy or sell. It’s no different than checking your favorite spot for the best sunrise view. You wait, you watch, and you finally capture that perfect moment.
Types of Charts
There are different types of charts that traders use. Each offers a unique way of visually interpreting the cryptocurrency market.
Line Charts
The simplest of all charts. It plots points over a period and connects them with a line. Great for having a basic understanding of price movement, but not much else. Think of it like dipping your toes in a pool, rather than jumping in.
Bar Charts
These charts provide a bit more information, showing the opening, closing, high, and low prices for each period. A bit like looking at a pizza cut into slices of different sizes, you get a better perspective of the whole picture.
Candlestick Charts
Candlestick charts are the go-to for most traders. They provide a visual insight into the price action during a specific time period. The ‘body’ shows the opening and closing prices, while the ‘wicks’ indicate the highs and lows. It’s like reading a novel where each candle tells a story of battle between buyers and sellers.
Technical Analysis Basics
Technical analysis, or TA as the cool kids call it, involves using past market data to forecast future price movements. It’s not quite a crystal ball, but it’s close.
Support and Resistance
Support levels act like a trampoline where prices bounce back up, while resistance levels are like a glass ceiling prices struggle to break. Traders use these concepts to anticipate market trends. It’s all about finding out where the market’s comfort zone is.
Moving Averages
Moving averages smooth out price data to create a trend-following indicator. It’s like blending a smoothie, removing all the lumps and bumps for a smooth sip. Common types include simple moving averages (SMA) and exponential moving averages (EMA).
| Type | Description |
|---|---|
| Simple Moving Average (SMA) | An average of prices over a set period. |
| Exponential Moving Average (EMA) | Averages prices by giving more weight to recent data. |
Relative Strength Index (RSI)
RSI is a momentum oscillator that measures the speed and change of price movements. It’s like a speedometer telling you if the market’s going too fast or too slow. A reading above 70 might indicate an overbought condition, while below 30 suggests oversold.
Real-World Use Cases
Sometimes, diving into the data isn’t just about numbers. Stories from the trenches can illuminate the charts.
Let’s say a trader named Alex bought Bitcoin when the RSI was at 28, an oversold signal. He held onto it, watching the candlesticks rise like the bubbles in his morning coffee. When the price hit a resistance level, he cashed out. Alex now tells his pals it was skill, though luck had a hand in it too.
Trading Strategies
The number of strategies out there can feel like standing in an ice cream shop. Here’s a scoop of the popular ones.
Day Trading
Day trading involves buying and selling within a single day. Quick in and out. It’s the espresso shot of trading—fast, intense, and not for the faint-hearted.
Scalping
Scalping is all about making a small profit from small price changes. It’s like swiping a few dollars off the table whenever you see an opportunity open up.
Swing Trading
Swing traders hold trades from a few days to several weeks. This strategy is like riding the market waves, trying to catch a sweet swell before paddling back out.
Emotions and Trading
Trading is not just a game of numbers; it’s also about keeping your cool. Emotions can wreak havoc if they get the upper hand. Traders often say, “Keep emotions in check, or they’ll check you.” It’s about learning discipline, sticking to your plan, and not letting fear or greed take the wheel.
Conclusion
Mastering cryptocurrency trading is akin to perfecting a recipe. It requires patience, constant refinement, and a pinch of luck. But knowing your charts and strategies can help prepare you for the market’s complexities. Use these insights like a map, guiding you through the cryptocurrency seas. With practice and learning, the unknown becomes a little less intimidating and a lot more navigable.